


 Home
Home

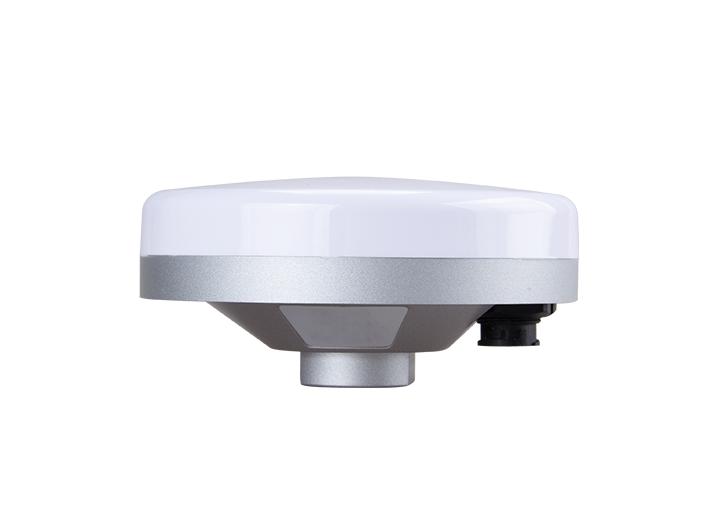
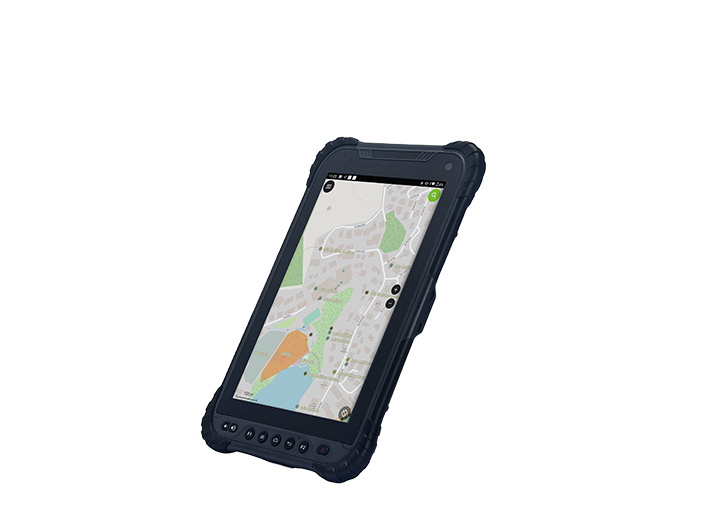
Orion ONE
GNSS Receiver
GNSS Receiver
learn more


 2025-09-09
 Chloe
Chloe


In GNSS surveying, understanding satellite availability and distribution is essential for accurate measurements. One of the most intuitive tools for this purpose is the Skyplot—a visual representation of the satellites above your survey point.
Checking a Skyplot before or during fieldwork helps users identify potential issues caused by satellite blockage or uneven distribution, ensuring more reliable positioning results.
A Skyplot is a polar coordinate diagram showing the positions of all visible GNSS satellites above a specific location. It provides a clear, at-a-glance view of satellite geometry, which can significantly affect positioning accuracy.
Key components of a Skyplot include:
Azimuth: The horizontal direction of each satellite relative to true north.
Elevation: The vertical angle of the satellite above the horizon.
By visualizing both azimuth and elevation, users can quickly assess which satellites are available and how they are distributed in the sky, helping to anticipate potential measurement errors.
The Skyplot is typically represented as a circular diagram:
Center = Zenith (90° elevation)
Outer edge = Horizon (0° elevation)
Each point corresponds to a satellite, with its position indicating azimuth and elevation.
Elevation Mask (Height Cutoff Angle):
Definition: A minimum elevation threshold; satellites below this angle are excluded from calculations.
Purpose: Reduces multipath effects and signal degradation from low-elevation satellites.
Example: Setting a 15° elevation mask filters out all satellites between 0° and 15° elevation on the Skyplot, ensuring only higher-elevation satellites contribute to positioning.
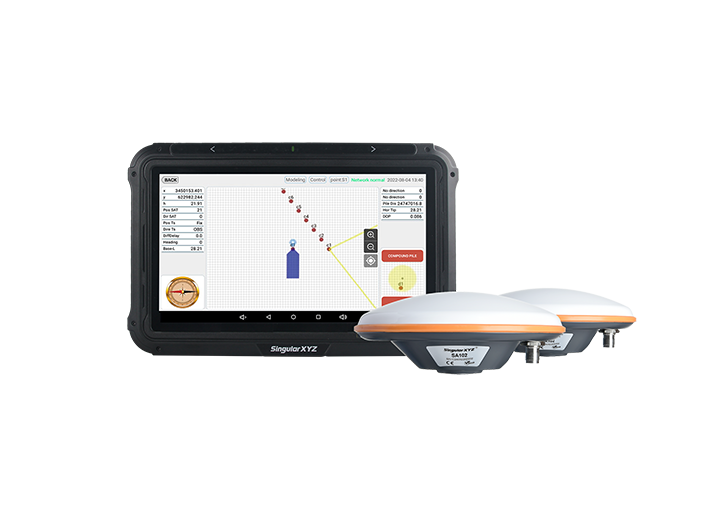
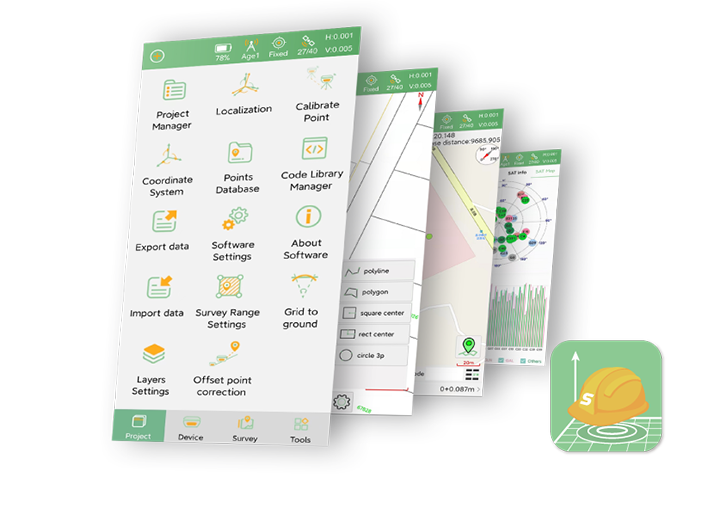
Using SingularPad:
After connecting the RTK receiver with SingularPad via Bluetooh, click the satellite icon in the top status bar and enter the SAT Map interface to view real-time satellite distribution.

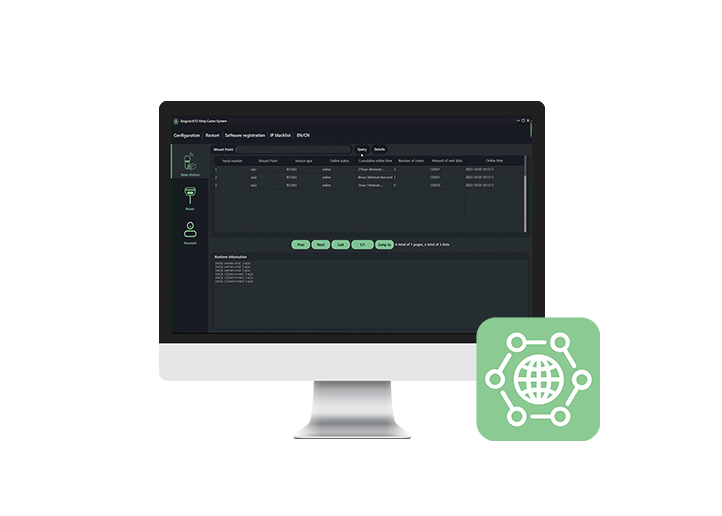
Using the Receiver's Web Interface:
Access the GNSS receiver's webpage via WiFi, and navigate to Device Information >> Satellite Sky Plot section to view a live Skyplot.

Benefits:
Whether in the field or monitoring remotely, SingularXYZ products make it easy to visualize satellite geometry, helping users make informed decisions about measurement quality and survey setup.
Survey Point Selection: Identify open locations free from obstructions.
Survey Planning: Avoid operating during periods with poor satellite geometry.
Post-Processing Analysis: Determine whether decreased positioning accuracy is related to satellite distribution.
Skyplots are a critical tool for GNSS engineers and field surveyors alike. By providing a visual overview of satellite geometry, they help improve measurement reliability and decision-making. With SingularXYZ products, users can easily access and monitor Skyplots in real time, enhancing survey accuracy and operational confidence.